Feature Story
Design an application for monitoring the power utilization, power forecast for the GE oil & gas operators. The user would be needing a bird-view[Map view], list view for selecting wells and compare each selection w.r.t the power usage, production cost.
Must haves
- Map View, Satellite view, List view, Heat maps, well selection.
- Well level view for learning more about each oil well.
- Need a simplified view to select required wells and proceed to analysis, if needed.
My Role .
- Brainstorm with Product Owners, User representatives to understand the problem statement and identify the different user scenarios.
- Design wireframes, have design walk thru with user representatives to get the reviews, and implement the suggested changes.
- Also, get the review from Ux group to make the design crisp and clean.
- Maintain the brand styling without affecting the feature requirements.
- Provide the UX specifications, to hand-off the design, interactions to the development team.
- Educate the developers, to help them understand the screen flow for different scenarios.
Research & Gathering Information
- White-boarding with subject matter experts (SME), to dwell in to the details of each scenario.
- Understand the user concerns, interacting with user representatives.
- Identify the KPI, define the information architecture.

White Boarding 1

White Boarding 2
Sitemap – Information Architecture, Navigation

Sitemap, Information Architecture and Users
Design Files – UX and Notes
- With the dashboard design, the user would be comfortable in locating the oil wells , power usage(indicated by circles for different power levels), electric lines and area coverage.
Dashboard with Map view, Widgets for Power, Predictions and Wells Information

Dashboard with Map view, Widgets for Power, Predictions and Wells Information
Dashboard with Map view, Widgets for Power, Predictions and Wells Information
- User can zoom in to view the oil wells and other assets, to know more about each well oil production, power usage and well status.

- Well level view, showcasing the assets and status at each oil well
- This is simplified list view, which will enable user to select the required wells and proceed with any analysis, if needed.
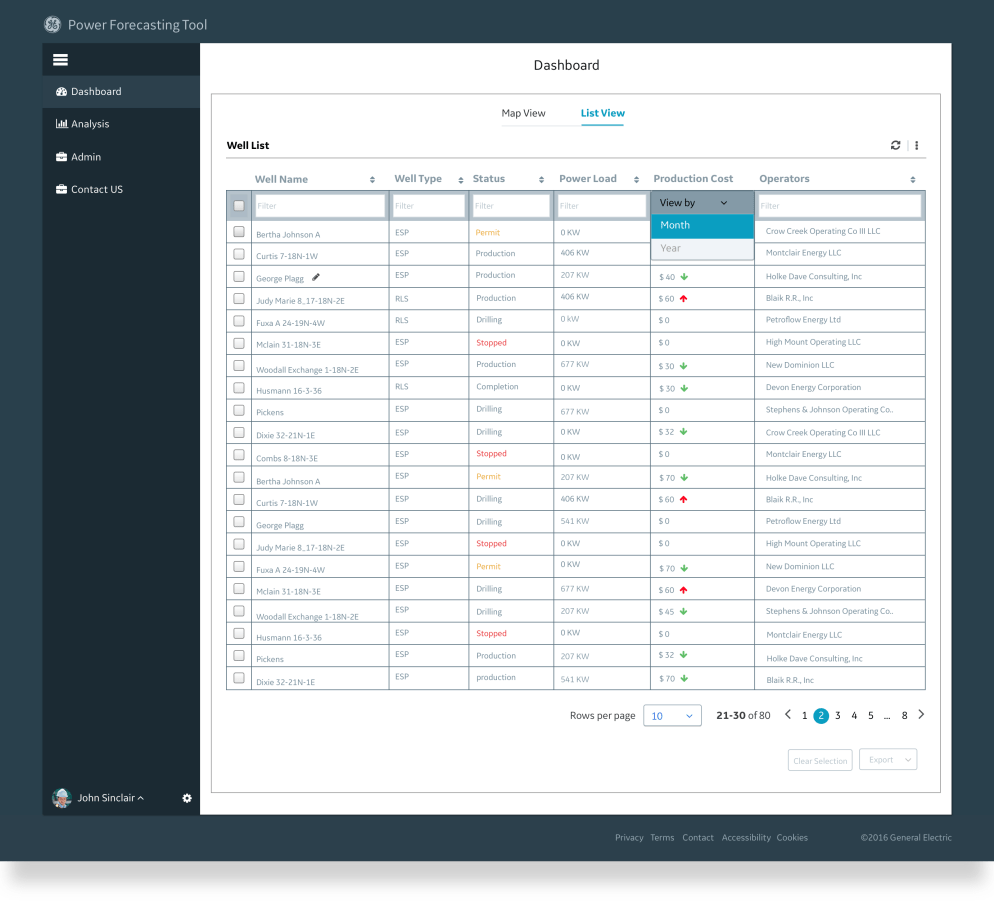
- Dashboard, List view showcasing all the wells, other details laid out in different columns
Tool set
- SketchApp
- Craft Plugin
- InVision App – Design Collaboration, Review and Initial Usability test
